How LLM Observability with Langfuse Eliminates Debugging Guesswork
Discover how integrating Langfuse tracing with LangChain pipelines brings transparency, reproducibility, and systematic debugging to LLM-powered applications.
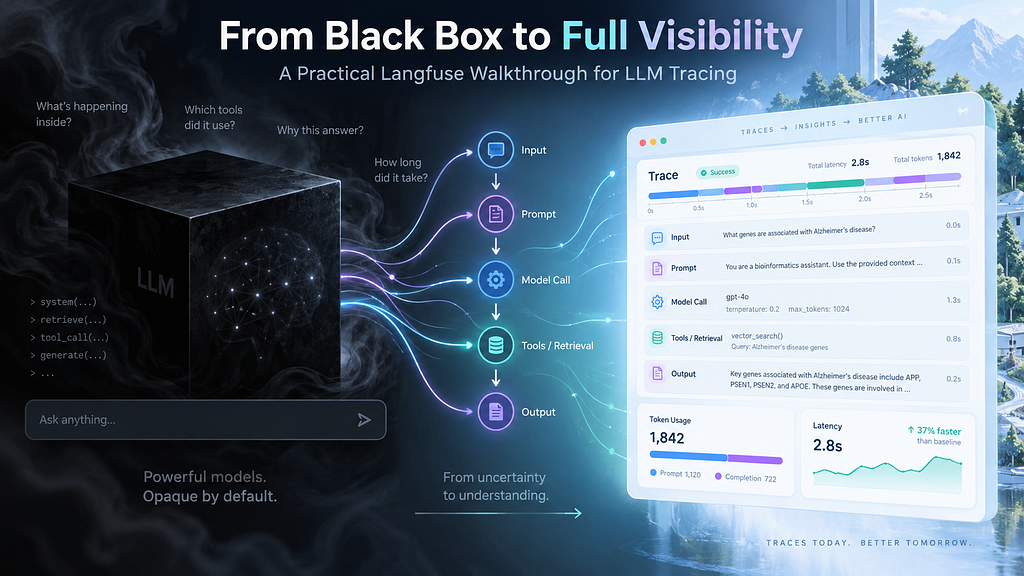
When developers first start building applications powered by large language models (LLMs), the workflow often seems deceptively simple. You write a prompt, send it to an API, receive a response, and if the output looks correct, you move on. However, as applications grow in complexity—incorporating frameworks like LangChain, multi-step logic, or Retrieval-Augmented Generation (RAG)—debugging becomes a major challenge. Without proper visibility, developers only see the final output, leaving them blind to what occurred during intermediate stages.
This "black box" dilemma is what led developer Suvra Nath, who has a background in bioinformatics, to explore LLM observability. In fields like computational biology, reproducibility and traceability at every stage of a pipeline are standard requirements. Nath turned to Langfuse, an open-source observability tool, to bring that same level of transparency to LLM workflows. By implementing tracing, developers can transition from a simple "input-to-output" view to a detailed execution story that captures prompts, model calls, token usage, latency, and metadata.
Building a Traceable Support-Ticket Pipeline
To demonstrate how observability works in practice, Nath constructed a basic support-ticket routing application using LangChain. The application's goal is simple: read an incoming customer support ticket and determine which department (such as maintenance or billing) should handle it.
The architecture relies on LangChain to connect a prompt template to a model. The application defines a prompt that instructs the model to route tickets to "maintenance, billing, account-access, or general-support" and return the team and a short reason. The model selected for this implementation is OpenAI's gpt-4o-mini.
When a ticket like "My heating has stopped working" is processed, the chain sends the formatted prompt to the model and returns the routing decision. If something goes wrong—for example, if a heating complaint is routed to the billing department—a developer relying solely on terminal outputs will struggle to pinpoint the error. Tracing provides the diagnostic data needed to find out whether the issue lies in the prompt, the model call, or the application logic.
Integrating Langfuse for Execution Visibility
Connecting the LangChain application to Langfuse requires a few configuration steps. First, developers set up a Langfuse project (Nath named theirs "llm-bio") and generate API keys. These credentials, which include the public key, secret key, and host URL, are stored securely in a .env file alongside the model provider's API keys.
The integration is achieved using the Langfuse callback handler for LangChain (from langfuse.langchain import CallbackHandler). When invoking the LangChain pipeline, this handler is passed into the execution configuration. This allows Langfuse to observe the run behind the scenes without changing the core application logic.
By defining a run configuration, developers can attach specific metadata and tags to each execution. For instance, the configuration can include the run name, tags like "langfuse-walkthrough", and metadata identifying the ticket_type (e.g., "maintenance" or "billing"). This metadata makes it possible to filter, search, and organize traces within the Langfuse dashboard once the application begins generating hundreds or thousands of runs.
Analyzing and Comparing Traces
Once the application runs, the Langfuse dashboard records the execution trace. Opening a trace allows developers to inspect the entire lifecycle of a single request. They can verify the exact input sent to the model, check the exact prompt template used, view the raw response, and measure performance metrics like latency and token consumption.
Running a second ticket—such as a billing query about a double charge—generates a separate trace. With multiple traces recorded, developers can perform side-by-side comparisons. This analysis helps confirm whether both runs utilized the correct model, if the expected metadata was attached, and how latency or token usage varied between different requests.
While a support-ticket router is a straightforward example, these observability principles scale directly to production-grade systems. In a complex RAG pipeline involving query processing, embedding models, vector database searches, and prompt construction, tracing is essential. It allows developers to quickly identify whether a poor final answer was caused by low-quality retrieved documents, an incorrect embedding, or a model hallucination.
What it means for developers
For developers, adopting LLM observability represents a shift from guessing to systematic debugging. Instead of treating LLM APIs as unpredictable black boxes, tracing provides the empirical evidence needed to reproduce errors, optimize prompts, and control costs. It ensures that applications are not just functional, but also maintainable and reliable over time.
As developers experiment with different prompts, configurations, and models to optimize their pipelines, managing multiple API accounts and tracking costs can become burdensome. To simplify this process, developers can try top AI models cheaply through one API at https://apixoai.online. This streamlined access allows teams to test different model behaviors, compare latency, and trace performance across various providers without the hassle of maintaining separate API keys and billing accounts. Ultimately, combining robust tracing tools like Langfuse with flexible API access enables developers to build more transparent and resilient AI applications.
Source: Debugging LLMs Without Guesswork: A Practical Langfuse Tutorial — Towards AI. Written by the Apixo team from that report.
One key for Claude, GPT, GLM, DeepSeek and more. Pay per token with crypto.
Get your API key