Why Your AI Agent Monitoring Dashboard is Lying to You
A green 200 OK HTTP status doesn't mean your AI agent gave the right answer. Discover why traditional monitoring fails for multi-agent systems and how to fix it.
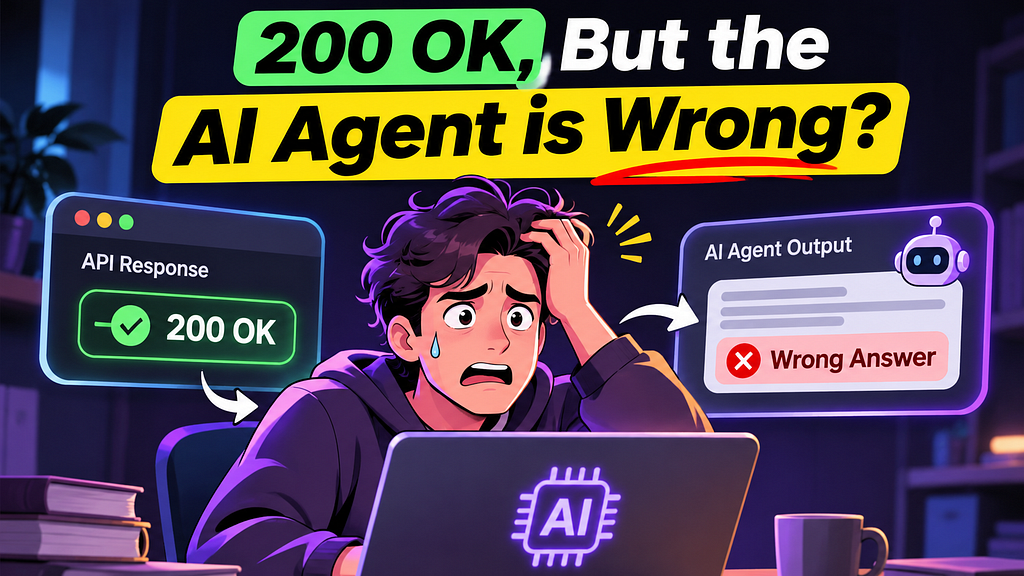
Deploying AI agents to production often brings a false sense of security. A user reports an incorrect answer, but checking the monitoring dashboard reveals entirely green metrics. Error rates remain flat, response times look healthy, and the CEO agent returns a smooth "200 OK" in 2.3 seconds. Traditional monitoring checks HTTP status codes, error rates, and speed, assuming inputs yield consistent outputs. Multi-agent systems break this assumption. A request can complete successfully while the agent inside quietly fails.
To understand these hidden issues, consider a mortgage lending assistant application. A FastAPI service routes incoming requests to one of five distinct agents: a prospector, a borrower agent, a loan officer, an underwriter, and a CEO assistant for internal analytics. These personas interact with databases, language models, and Model Context Protocol (MCP) servers before generating a reply. With so many moving parts, failures can easily hide behind successful HTTP requests.
Unseen Failures in Multi-Agent Systems
Traditional dashboards routinely miss several critical problems. First, silent tool failures occur when an MCP tool returns empty data, and the agent proceeds to answer using incomplete information. Second, cascading latency happens when a slow database query delays a model call, leaving external monitors with only a general sense of sluggishness without identifying the specific bottleneck. Third, context overflow arises when an agent stuffs too much into a prompt, resulting in a cryptic failure or a generic timeout for the user. Finally, nondeterminism means asking the same question twice yields different results, making bugs difficult to reproduce on a local laptop and complicating compliance in regulated fields like lending.
Addressing these challenges requires deeper LLM observability through traces and spans. A trace provides a complete record of a single request, built from individual steps called spans. These spans form a parent-and-child tree detailing model calls, tool uses, and database queries, complete with inputs, outputs, token counts, per-step latency, and metadata. By organizing traces with user and session IDs, teams can replay an agent's decision path step by step instead of guessing.
What it means for developers
Developers building production applications need tools that go beyond basic status checks. MLflow Tracing captures intermediate steps and integrates with over twenty GenAI libraries. For frameworks like LangChain and LangGraph, enabling autologging requires just a single line, such as mlflow.langchain.autolog(), while custom Python code can use the @mlflow.trace decorator. For developers looking to experiment with underlying technology, you can try top AI models cheaply through one API at https://apixoai.online.
Beyond basic tracing, maintaining quality requires advanced evaluation strategies. Deterministic checks handle simple rules, but assessing quality involves "LLM-as-a-judge" approaches, where a second model grades outputs against criteria like tool call correctness, call efficiency, relevance, safety, and plain-language guidelines. Furthermore, using a prompt registry acts like Git for prompts, connecting specific prompt versions to evaluation scores and maintaining an audit trail for regulated industries.
Moving from Demo to Production
Shifting an agentic system from a local notebook to a robust production environment requires specific architectural choices. First, swap default file-based storage for a real database like Postgres or MySQL, and store artifacts in object storage to handle multiple concurrent writers. Second, turn on async logging so trace exports happen in the background without impacting application performance, applying sampling under heavy traffic. Third, select judge models intentionally, keeping in mind that scoring a 500-example dataset with multiple judges generates thousands of inference requests. Finally, run evaluations automatically within CI pipelines rather than relying solely on notebooks.
By adopting traces, versioned prompts, and automated evaluations, teams can replace the comforting lie of a green dashboard with true visibility into what their AI agents are actually doing.
Source: Your Dashboard Says “200 OK,” but Your AI Agent Gave the Wrong Answer. Now What? — Towards AI. Written by the Apixo team from that report.
One key for Claude, GPT, GLM, DeepSeek and more. Pay per token with crypto.
Get your API key