Why Default AI Decision Thresholds Fail and How Cost Ratios Fix Them
A well-calibrated AI probability does not equal a decision. Learn why default 0.5 thresholds miss critical cases and how cost ratios optimize real-world model actions.
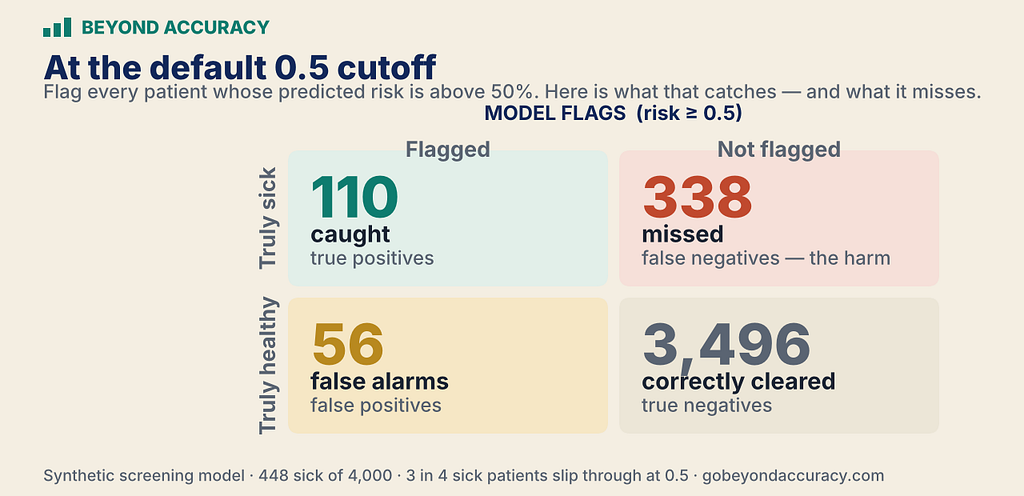
Predictive artificial intelligence models can generate highly accurate probabilities, yet converting a probability into an actionable binary decision remains a separate engineering step. A recent analytical framework demonstrates that even when a machine learning model possesses strong performance metrics—such as an Area Under the Receiver Operating Characteristic curve (AUROC) of 0.84 and precise calibration—relying on standard default thresholds can cause critical failures in deployment.
The study analyzed a synthetic dataset of 4,000 subjects with an 11% disease prevalence (448 actual positive cases). Although the tested model accurately ranked higher-risk subjects above lower-risk ones and provided honest probability estimates, applying the standard default decision cutoff of 0.5 (a 50% probability threshold) resulted in catching only 110 out of the 448 true cases. By missing 338 positive cases while generating 56 false alarms, the default decision rule failed not because the model was inaccurate, but because the threshold was set without accounting for real-world consequences.
The flaw in standard classification defaults
Operating under a default 0.5 threshold implicitly assumes that a false negative (a missed positive case) and a false positive (a false alarm) carry identical costs. In high-stakes applications like medical screening, fraud scoring, or anomaly detection, these errors are rarely equal. When working with uncommon outcomes, moderate model discrimination often leaves many genuine positive cases below the 50% mark, causing a default rule to miss the vast majority of target events.
To adjust cutoffs statistically, researchers often use Youden’s index, which maximizes the sum of sensitivity and specificity (J = sensitivity + specificity - 1). On the 4,000-subject evaluation dataset, applying Youden’s index lowered the action threshold to 0.12. This increased sensitivity from 25% to 77%, detecting 344 of the 448 true cases. However, false alarms simultaneously climbed from 56 to 848. While Youden’s index offers a statistical reference point when cost data is missing, it still assumes that a point of sensitivity is worth exactly the same as a point of specificity, ignoring prevalence and operational costs.
Quantifying risk with cost ratios and decision curves
To align model predictions with real-world priorities, decisions must be governed by an explicit cost ratio (R), defined as how many times worse a missed case is compared to a false alarm. For a calibrated model, the optimal probability threshold (p_t) to minimize expected cost is calculated using the formula:
p_t = 1 / (1 + R)
When R = 1 (equal cost), the threshold is 0.50. If a missed case is 9 times worse than a false alarm (R = 9), p_t drops to 0.10 (10%), prompting action at a much lower predicted risk. Conversely, if a false alarm is 4 times worse than a missed case (R = 0.25), p_t rises to 0.80 (80%).
To confirm whether acting on a specific threshold adds value over baseline strategies—such as taking action on everyone or taking action on no one—evaluators turn to Decision Curve Analysis (DCA), established by Vickers & Elkin in 2006. DCA evaluates net benefit using the equation:
Net Benefit = (True Positives / N) - (False Positives / N) * (p_t / (1 - p_t))
Across clinically relevant risk thresholds (5% to 30%), the experiment confirmed that the model delivered higher net benefit than either baseline alternative, confirming its utility before real-world deployment.
What it means for developers
For software engineers and data science teams, these findings highlight that model metrics like F1 score, AUROC, and calibration only measure predictive capabilities. Defining the decision policy remains the developer's responsibility.
When integrating predictive intelligence into applications—whether building custom risk engines or implementing model API calls via platforms like Apixo, where developers can try top AI models cheaply through one API key—teams should separate risk estimation from decision thresholds.
Developers evaluating risk classification systems should follow a clear process:
- Verify Calibration First: Ensure predicted probabilities match actual outcomes in the target population, as shifts in population density or prevalence can invalidate calculated thresholds.
- Define Explicit Cost Ratios: Work with domain experts to quantify the exact penalty ratio between false negatives and false positives rather than defaulting to 0.5.
- Run Decision Curve Analysis: Plot net benefit against "action for all" and "action for none" defaults across realistic operational threshold ranges to verify that the model offers a true decision advantage.
Ultimately, an AI model provides a probability, but the threshold converts that probability into an action. Ensuring that the decision boundary reflects true operational costs is what turns raw predictions into trustworthy software workflows.
Source: Your AI Model Predicts Risk. But Who Decides When to Act? — Towards AI. Written by the Apixo team from that report.
One key for Claude, GPT, GLM, DeepSeek and more. Pay per token with crypto.
Get your API key