Benchmark Tests Multimodal LLMs on Extracting Data From 30 Chart Types
A new benchmark evaluates 10 multimodal AI models on extracting structured numerical data from chart images, revealing major differences in accuracy, speed, and token cost.
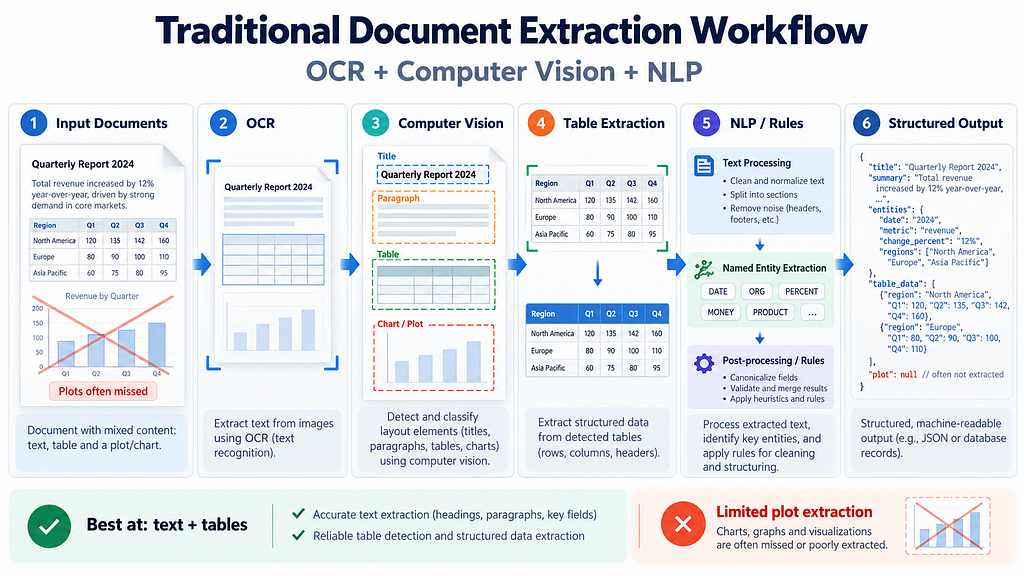
Data extraction from unstructured documents has traditionally relied on complex optical character recognition (OCR) setups, custom natural language processing pipelines, and specialized machine learning models. While text extraction has advanced rapidly with generative AI, recovering numerical data buried inside visual figures—such as plots, charts, and diagrams—remains a distinct challenge. A recent hands-on benchmark conducted by a software engineer with 14 years of experience evaluates how accurately modern multimodal large language models (LLMs) can read and extract raw numbers from synthetic chart images.
Testing 10 LLMs Against 30 Chart Types
The experiment evaluated 10 multimodal AI models across OpenAI, Anthropic, and an open-weight architecture (Qwen3.8 27B accessed via OpenRouter) across 30 different chart variations. Rather than gathering real-world figures requiring manual annotation, the benchmark utilized Python's Plotly library to generate synthetic visualizations with known underlying data. This approach provided exact ground-truth values to measure model responses against.
The pipeline, orchestrated with Prefect and structured via Pydantic AI, sent high-resolution chart images alongside strict JSON schema instructions to each model. Out of 300 total evaluations, performance varied dramatically depending on the chart structure. Simple visualizations—including standard line graphs, pie charts, scatter plots, heatmaps, and waterfall charts—yielded a flawless 1.0 F1 score across all tested models. For histograms and line charts, the presence or absence of explicit data labels did not significantly impair performance across most models.
However, complex visual layouts exposed clear limitations. Chart types like violin plots, 3D surface charts, stacked bar charts, and multi-series area plots saw steep performance drops. In one notable instance, three separate models extracted plausible values from an area chart containing Wind and Solar data series, but completely swapped the two labels despite a visible legend present in the image.
Precision, Latency, and Cost Trade-offs
To evaluate numerical fidelity beyond structural detection, the benchmark analyzed Root Mean Squared Error (RMSE), Mean Absolute Percentage Error (MAPE), and Pearson correlation across 286 evaluations where matched numerical data could be calculated. Model-level Pearson correlations ranged from approximately 0.987 to nearly 1.0. GPT-6 Astra recorded the lowest Mean Absolute Percentage Error at roughly 0.09%, compared to approximately 1.10% for Qwen3.8 27B.
The study also highlighted significant differences in speed and financial cost across providers:
- GPT-5.5 led total accuracy with an average F1 score of 0.951, but required an average extraction latency of 35.7 seconds and cost approximately $0.81 across 30 charts.
- Claude Opus 5 delivered a 0.912 F1 score in just 11.2 seconds—nearly three times faster in this setup.
- GPT-6 Luna processed all 30 charts for roughly $0.015 while maintaining a high 0.908 F1 score.
Token consumption patterns varied noticeably between providers. Anthropic models used slightly more tokens per image than OpenAI models. Meanwhile, Qwen required double the tokens to encode the same visual image, making it more expensive over paid API endpoints unless hosted locally on private hardware. Across all 300 evaluations, total estimated token expenditures remained under $5.00 ($4.98 based on October 2026 pricing assumptions).
What it means for developers
For data engineers building document processing pipelines, these findings show that multimodal vision models can automate basic chart parsing without complex computer vision logic. Simple bar and line graphs can be converted into structured Pydantic models with near-perfect reliability, making them immediate candidates for automated ingestion.
However, production architectures must account for structural failures and subtle hallucination risks. When models misattribute data series or fail to parse dense multi-dimensional plots (like 3D surfaces or violin charts), traditional regression metrics may fail to catch the error if data points are omitted entirely. Pipelines must incorporate explicit validation, human-in-the-loop review, and schema constraints to maintain data lineage.
Because accuracy, token usage, and latency differ significantly between models, testing across multiple providers is critical. Developers can try top AI models cheaply through one API at https://apixoai.online to evaluate multimodal performance and optimize pipeline speed without managing multiple subscriptions. As this benchmark demonstrates, matching the right chart type to the right model architecture is crucial for balancing cost and accuracy in automated data pipelines.
Source: Rethinking Data Extraction in the Age of AI — Towards AI. Written by the Apixo team from that report.
One key for Claude, GPT, GLM, DeepSeek and more. Pay per token with crypto.
Get your API key